Introduction to Analytics

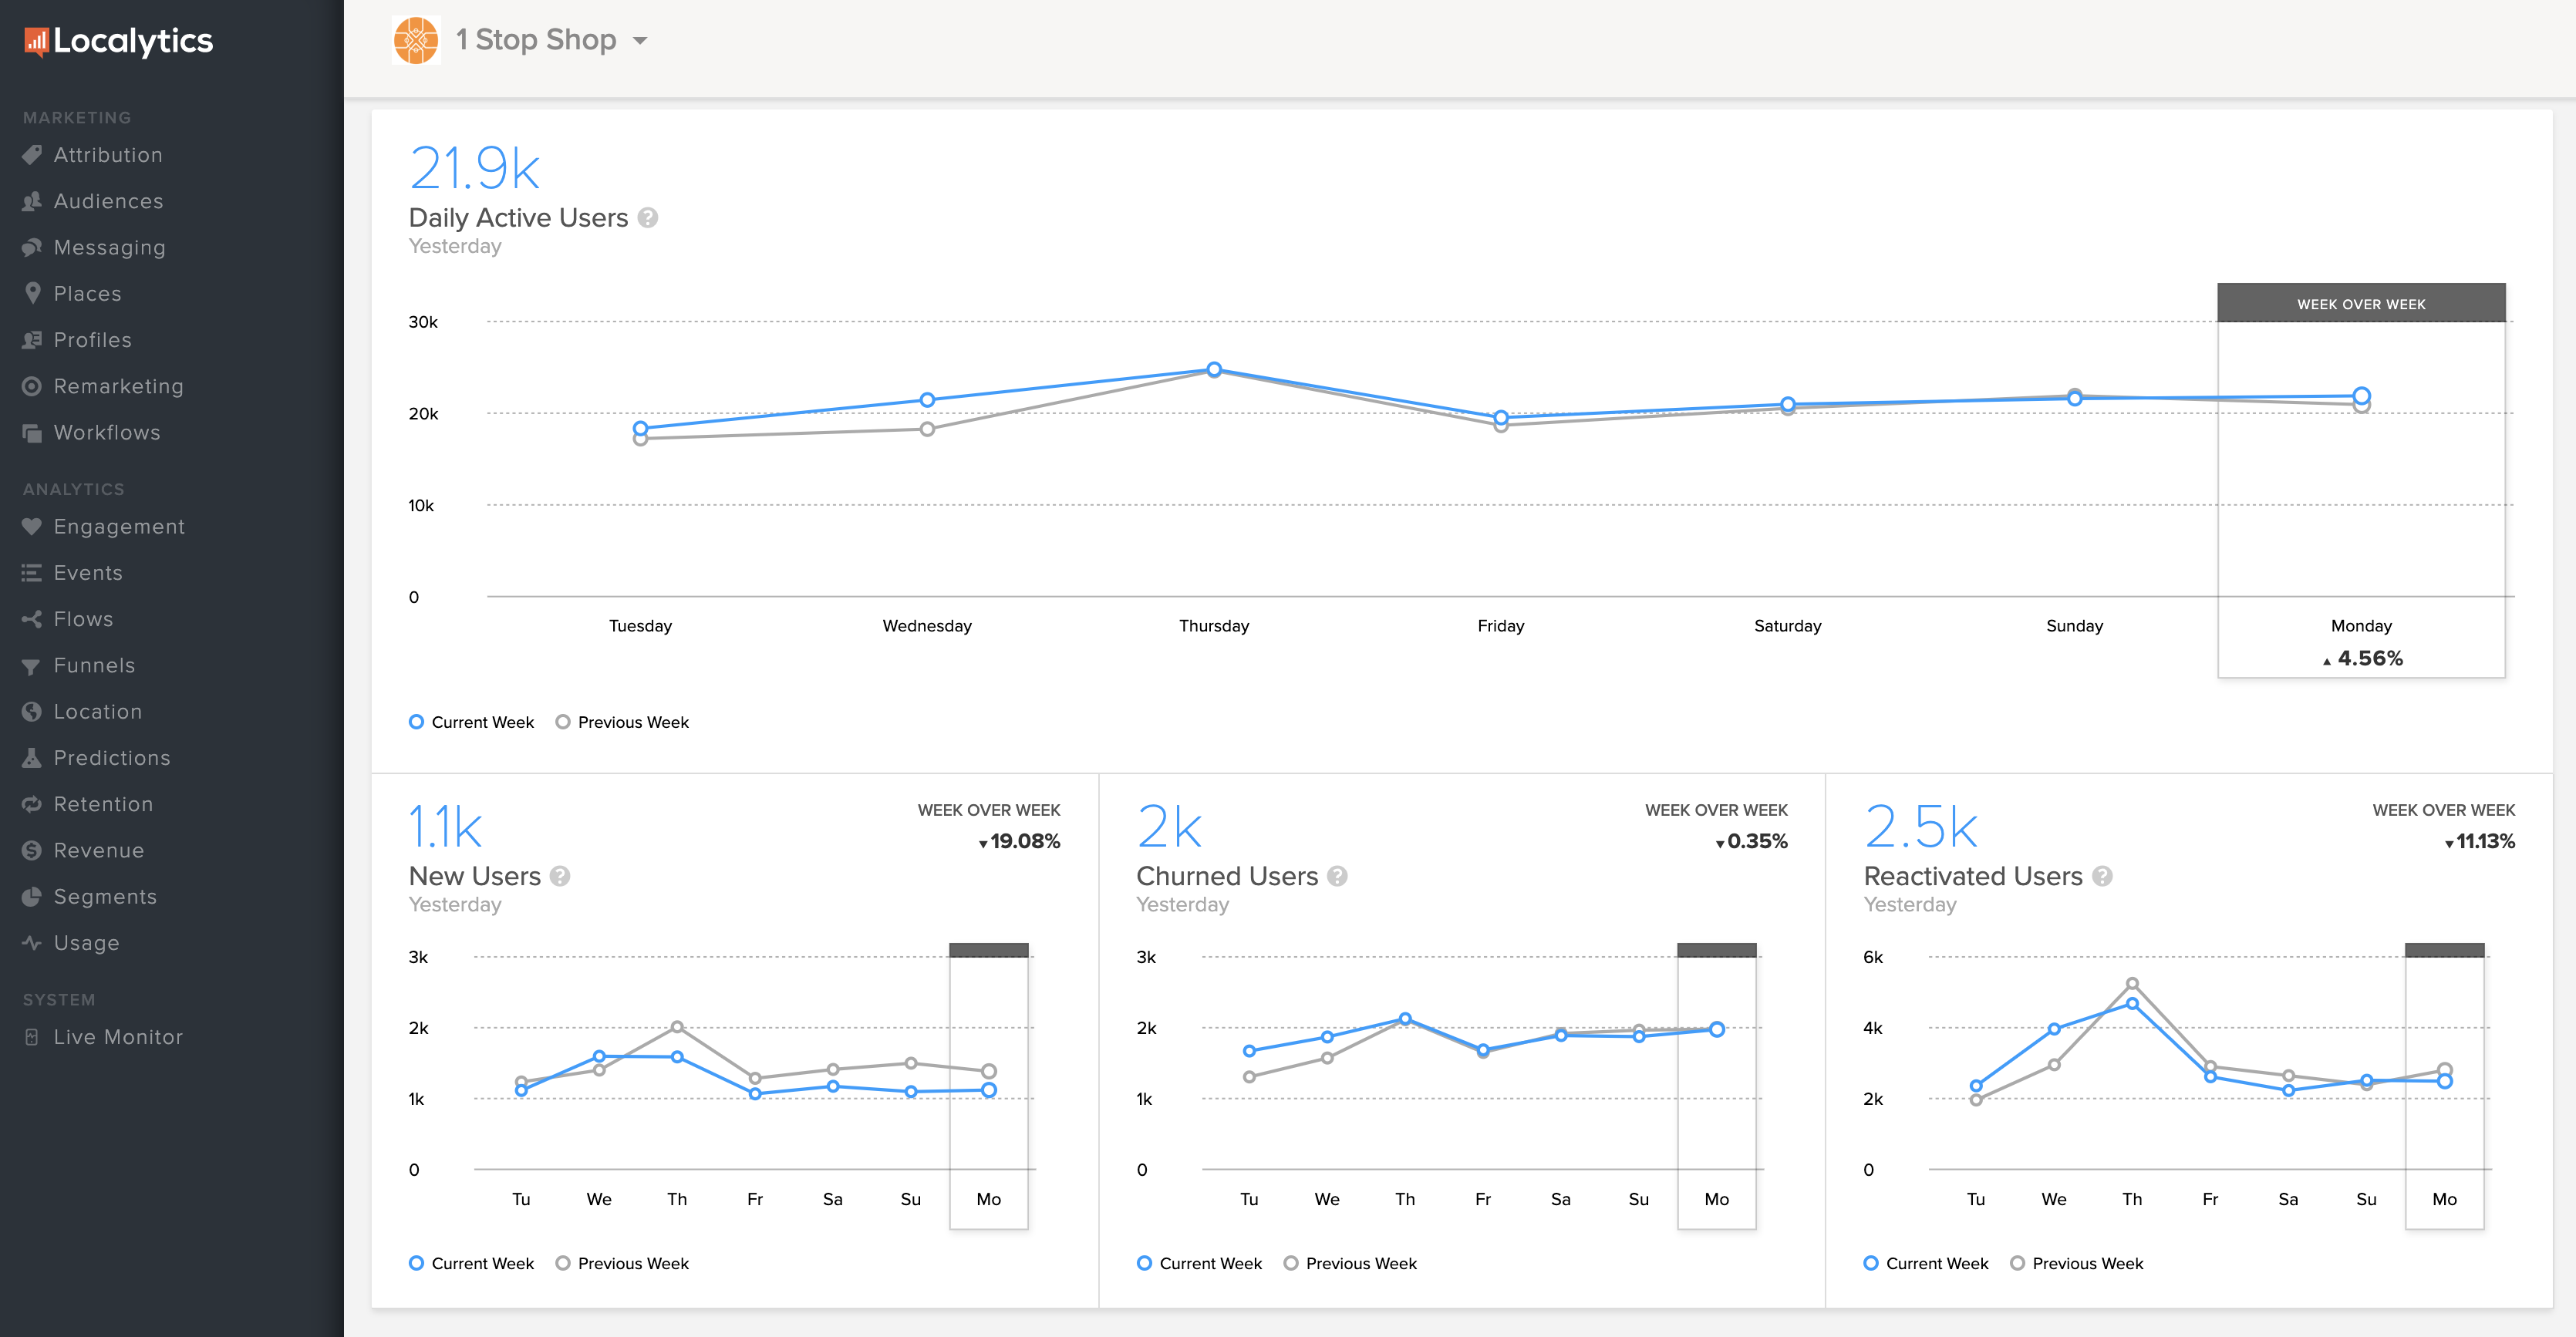
Every time you log in, the main dashboard presents key performance metrics you should be paying attention to. It also shows you opens, sends, and goal-based insights for campaigns launched in the past 14 days.
For each day, the main dashboard currently reports the following metrics:
| Main Dashboard Metric |
Definition |
|---|---|
| Daily Active Users |
Number of users who had a session |
| New Users | Number of users who had a session for the first time |
| Churned Users |
Number of users who have gone 30 consecutive days without a session |
| Reactivated Users | Number of users who had a session after being inactive for 30 days or longer |
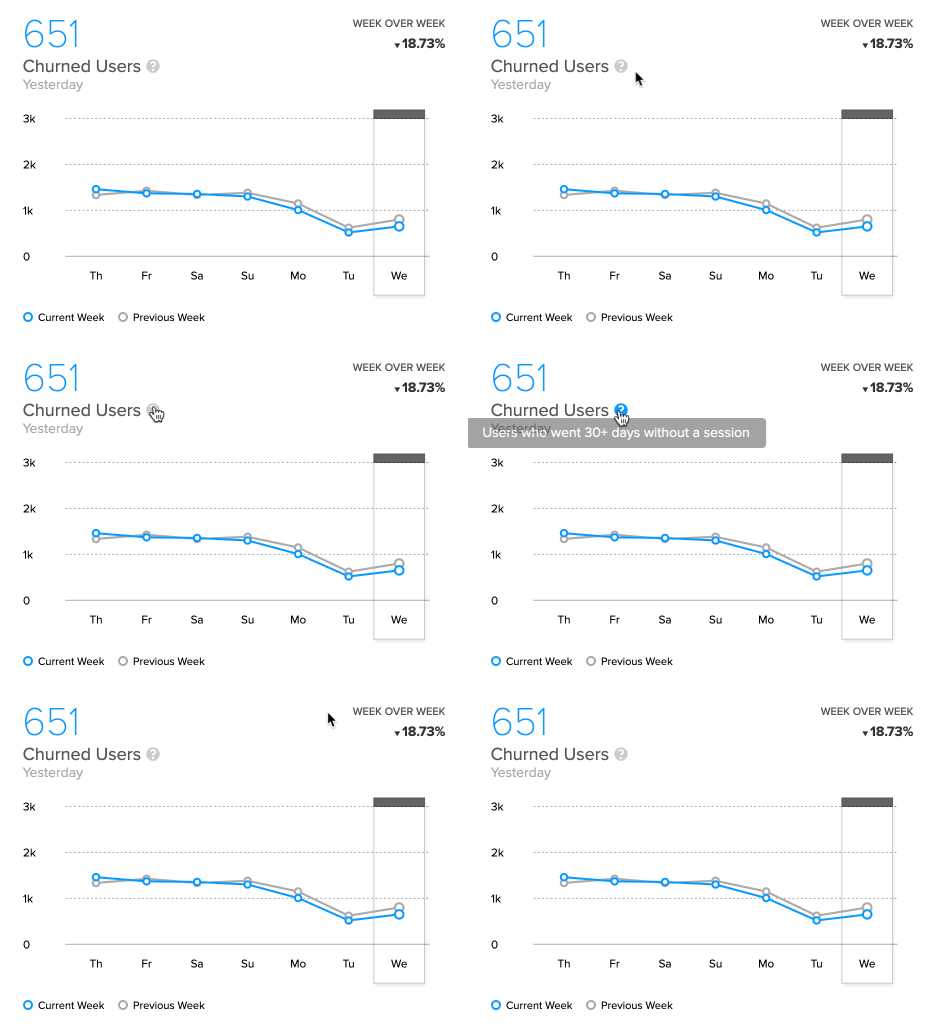
Tip: For more information on about any of the metrics, point to the question mark next to the metric name. A quick explanation pops up.

For more information, see: